

DebugBas
!DebugBas
Whilst investigating in my old archives for these rambles there were all sorts of little
programs which I found that I'd written - and which I had completely
forgotten about. Then
there are programs that I remember writing, but cannot find. Sometimes this
latter case is because they were on an ancient disc (floppy or hard) which
had been lost, crashed or formatted over. Into this latter category falls
the 'BASIC unsqueeze tool' which would unwrap squeezed BASIC into multiple
lines, with multi-line IF statements where necessary, and
allowed for function and procedure renaming. I've no idea where it went
![]() . I have the results of it, in things that it reconstructed, but nothing
more.
. I have the results of it, in things that it reconstructed, but nothing
more.
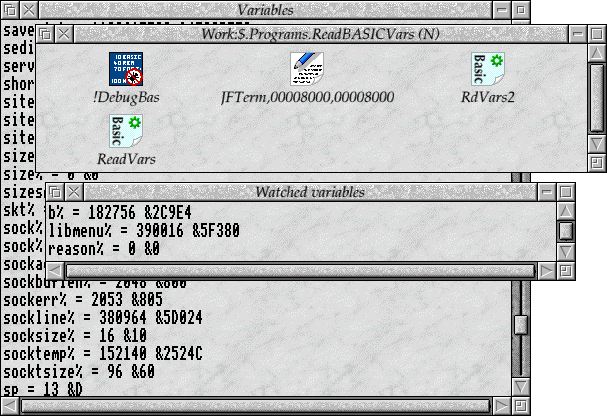
Into the former category falls the !DebugBas application. Or possibly ReadBASICVars, depending on where you look - it was so nascent it didn't even have a proper name. This was a development of some simple work to decode BASIC variables from of a dump of application space. The idea had been that an application could be paused (for example, by masking off its Wimp events) and its memory accessed in its paused state. Alternatively, memory could be dumped on a failure, and the relevant details captured so that it could be debugged offline - sort of similar to the way in which Diagnostic Dumps worked, but simpler, for BASIC and 5 years earlier.
The application itself could either accept a dump of application space, or could be given an application to watch. A little icon could be dragged on to the application, and this would start the monitoring process. The variables would initially be enumerated in window, and then these details would be updated slowly over time. You could click on specific variables to add them to a 'watch' window, which would be updated on every poll.
Although the application didn't allow it in its final form, memory blocks would probably have been added. A separate experiment, a few years prior, had produced a parser which could be given data structure descriptions, and would allow information to be extracted in named form - for example, a Wimp window block could be decoded into named fields, including decoding the icon blocks based on the number of icons which were present. This would have been a useful library to incorporate - albeit the predefined structures that it knew about were simple Wimp and !Zap structures (as it dated from the time when I was working on !Zap).
Similarly, the application filter hadn't yet been added, but this would have been trivial through !JFPatch.
The whole thing was abandoned, I guess, because it is reasonably pointless to have this kind of debugging tool for BASIC. Being able to pause and investigate would be useful, except that there is a whole lot of work to be done to make that happen. But it's still BASIC. It would be better to write something for C applications, as that would actually have some use - rather than encourage the continued use of BASIC. Having a useful C application debugger that could monitor variables in windows would be quite neat, though.
Plus, at the time it was written I would have been working on !Doom so probably wouldn't have had time to progress it any further.
ModDebug
Speaking of tools that were completely forgotten, I had forgotten about the existence of a debugging tool until I began writing this ramble. I was just thinking about how modules were run, and how it would be handy to have an override, like 'Fortify', that could record and report who claimed which blocks in the RMA. Then you could find out who leaked memory when the module exited - really useful if you had a complex system. And then this niggling feeling told me that I'd done something like this before.
A quick search later, and I found ModDebug (or possibly ModDump as the module appears to be called). Amusing that I'd completely forgotten about it, but it was a pretty neat tool. It replaced the SWI OS_Module entry point with its own, which would track the allocations made by the module. As hackiness goes, it's pretty evil - both manipulating the OS SWI dispatch table directly, using the 'Modula-2 private word' in zero-page and directly using the module chain to locate modules to associate with the claim. When modules were killed, the blocks allocated by that module were displayed if they had not been freed.
There was also a *Command to display the list of claimants, either
for all components, or for a specific module. Claims that didn't come from
within a module (eg applications) would be marked as 'non-module'. Of
course if claims came from the , they
would all be lumped together, so any C module claims would be
indistinguishable. I guess it wouldn't be too hard to 'know' the call stack
for such calls and work out who really made them - but I didn't do that.
Debugging libraries
RISC OS, being made up to a significant degree out of assembler modules, can often be a pain to debug. A few libraries had been produced to help with this and there were headers in the RISC OS source for different ways of debugging things. Depending on the age and lineage of the modules, there might be completely different ways of debugging them. The most useful, early on, was the debug library which used 'DebugIt' as its primary way of writing out data.
The DebugIt module wasn't a single module - different versions could be produced for different types of debugging, either printing to the VDU stream, the serial port, network, or other more esoteric devices. The idea was that if you wanted to debug to something else, you just produced a different version of the module which did what you needed. The module itself supported simple operations to write characters and strings to the output, and these had to be implemented in all the modules.
This was pretty useful for a lot of debugging, but the macros that used the module were really quite annoying. For example:
    DLINE       "Line to write verbatim"
    DSTRING     r3, "R3 points to the string "
    DREG        r1, "R1 has value "
The library was pretty robust and had a few options for running in different modes. The header that provided it had direct support for the VDU output and DebugIt, as well as the mythical TML. "The Missing Link" was a Podule which essentially provided buffered output to another similar card. I believe you could set up two of these cards, one to send debug data, and another to receive it. They had a reasonable buffer and could run quite fast, so were very useful for low level debugging. We never had any, and so we pretty much ignored them.
For a lot of our non-Kernel debugging we used either the VDU stream, file stream, or DebugIt. I had created a very simple version of the module which would call out to the SysLog module to perform the logging. Together with a small modification to SysLog so that it would buffer characters until it received a complete line, this allowed us to debug to a file (which would only be written when the system was safe to do so) or to debug over the network using the UDP SysLog protocol, which was the only sane way to debug the filing systems.
Anyhow, debugging with those macros was fine for a while, but became very tedious for me. Not only was the syntax awkward, it didn't lend itself to being inserted unobtrusively into code - you had to bracket the debug code with conditionals if you didn't want the debug building into a release build.
Rather than fixing the macros to be more friendly, I decided to write my own debugging headers. This might seem a little heavy handed, and using the 'Not invented here' argument, but it made a lot more sense in many cases. I needed something that I could work with day to day that didn't make me want to scream and which was flexible enough to handle debugging from different places.
The intention was to unify the different debug functions so that they could be used in any component, from the System Initialisation code, through the Kernel, and File Systems, up to the Wimp level. They needed to work in different environments as well, whether they were run inside the emulator, on new hardware (which might only have System Initialisation code), or on the existing hardware. Within the OS, it had to work within applications and in modules, and had to be reasonably fast - though speed wasn't paramount.
In use, the macros had to be unobtrusive, allowing it to be used inline with real code - and not confused with real code - and be able to be turned off easily.
The implementation placed a couple of constraints on how it could be used -
the code that implemented the functions had to be placed in the same relative
location to the invocation as when they were compiled (such that
'BL' could be used to call the debugging) and there had to be
a stack of at least 64 words. Some of the output types required other data
to be present in known places - a fixed mapping of the serial port registers,
for example - but in general I had a workable set of debug functions.
Instead of varying the macros depending on what was being written out,
I decided on formatter functions similar to those that I had created for
!JFPatch (and in many ways the macros are very similar to the
'REM' macro I created for my assembler).
The main debug macro was just a call to the formatter, which would process
the string and write the debug through the output functions as necessary.
The formatter used '%' as an escape for the formatter, followed
by the output type, and then a register specification. The formatters were
pretty simple:
- '
C' or 'S' CPSR or SPSR (didn't require a register specifier), broken down into flags and modes. - '
r' decimal value. - '
&' hex value. - '
c' character. - '
$' string pointed to by value.
The register numbers were specified in hexadecimal to make them only a single
character, but you could also use 'w',
's', 'l', and 'p' for
R12 (workspace), R13 (stack pointer),
R14 (link register), and R15 (program counter).
This meant that adding debugging to a program was very simple. Most of the time you only needed to include the macros in your code. For example:
    Debug_WriteF "  expr: type=%r9, val=%&0:%&1:%&2:%&3\n"
    Debug_WriteF "  line=%&C, aeline=%&B\n"
The decimal number decoding was performed by the formatter itself, so didn't even need to call out to the Kernel conversion SWIs (which would prevent its use in early initialisation). Because the debug code could use the System Initialisation debug entries as well as the higher level functions, it meant that the debugging could be used in device drivers that needed to start early on, such as the IRQ or Timer initialisation code, or parts of the video system.
Component development and testing
I think I've mentioned the way that I had developed and tested components in passing in other sections, as I learnt the best techniques for developing new features efficiently. As we all know, it's good practice to start out by developing a prototype which you can use to check if the feature or component will really work properly. And as we all know, there's a real danger of the prototype becoming the final version, with all its flaws in inherent limitations.
I found that prototypes were best written in a completely different language if you were truly intent on throwing them away at the end. That way, there was never a danger that you would be forced to used the prototype as the real thing. This counters the problem of the prototype becoming the real thing, but is terrible for the time you spent on it as none of the code is reusable.
After using this method a few times, I found it wasn't always applicable to all new features, and sometimes you knew you were going to be moving straight on to the version that would be released. In these cases I used a far more modular way of developing. Write the code to perform particular tasks, and write a small block of code that would test it. In C, this usually meant a simple library and a small command line application to exercise the functions in it. Unit testing in this way is hardly new, and should be the staple of all developments. In BASIC, you can do a similar thing, although I tended to write very little in BASIC so I had less need of such things.
In assembler, there's often more involved in creating the application that
can call the assembler in the right way, but the time invested is well worth
it. In general, I wrote a C application in the same way as if I were testing
a C library, with a small veneer to make the assembler callable using APCS
with the correct parameters. If the assembler needs R12
pointing to some workspace then creating that workspace, with the right
values in it, in C and passing this to a veneer function is pretty easy. It
might be tedious to create a structure definition that matches your
assembler workspace, but it pays off in the long run - once the structure is
defined, you can reuse it in other unit tests.
When adding new bits and pieces to assembler modules, I avoided writing the new features in assembler at all if I could help it. Writing the code in C, and testing it just like any other command line tool, means that the development time can be reduced significantly, and you can focus on the new code, rather than any of the peripheral bits that interface with it when it is in place.
This applied significantly to the Kernel, Filer and WindowManager. The more
complex bits that I didn't feel needed to be written in assembler were in C,
and tested completely outside of the environment they needed to run. When
built for testing, usually by setting a #define, the code would
include the necessary support functions stubbed in C - the produced
executables could be tested and, because they ran immediately in User mode,
any problems could be rapidly found and fixed.
When it came to Toolbox gadgets and objects, the same principles applied, but at a different level. Obviously you wouldn't write a Toolbox extension module in assembler - that would be crazy - but you also didn't need to write them as modules. The original versions of some of the objects and gadgets I wrote were a skeleton application which used a library for the test functions.
The extensions were written in such a way that the interfaces matched those of the gadget or object they were providing. This meant that they were easy to place in a final module without any changes (or possibly just a change of the lower level code that they linked against), and had the added advantage that you could see how the gadget might be called within an application. If it felt awkward calling a function that did something one way in the prototype, it would feel even worse if you had to do it on a shared gadget (as the gadget was meant to take the work away, not make it harder).
In many cases the little test programs had buttons to press to trigger actions or perform certain types of operations which were expected to fail. Once you had an application that could test the extension without actually being a Toolbox extension, you could automate tests like 'add 20 gadgets', 'delete them randomly', 'move them around', and so on, to make sure that your code was working as you expected. Using Fortify here meant that you could find the problems before the code got anywhere near running in SVC mode.
I still found bugs whilst running the modules in their expected places, but they were easier to track down as you could try simulating them in the test environment, where their failure wasn't quite as dangerous.
DDT
!DDT
Back in 2001, I was given the source to !DDT to work on, together with Robin Watts, to improve some visual and functional problems that !DDT has. !DDT is a beast of a program. The name - Desktop Debugging Tool (I'm pretty sure that the similarity to a pesticide - a bug killer - was entirely intentional) - was something of a misnomer as it doesn't actually let you debug in the desktop. The environment it does provide is similar to that of RISC OS 3.1, together with all the furniture that it offers, but is entirely implemented within the application. The rendering of its 'windows' on top of the current display is achieved by capturing the current screen at the interruption point and plotting it as the background.
To keep things as efficient as possible, !DDT sits on a number of entry points, including SWIs, and checks for operations that would affect it - it only relinquishes control of the display back to the parent application when it believes it to be performing screen operations. Thus, single stepping does not flicker the screen switching in and out of display types.
Trapping SWIs needs knowledge about how the system executes SWIs, which may very from OS version to version. It also changes slightly when a BTS supporting kernel is in use - lots of bad things can happen if the SWI capture doesn't know about it. There's also collusion with the Kernel's current domain workspace, as !DDT needs to know whether it has been switched out of memory, and therefore shouldn't be trapping the operations.
Additionally, the act of !DDT calling SWIs itself can change the behaviour of the system - you should not expect environment callback handlers to work in quite the same way when run under DDT. Most of the time that won't matter but if you were (say) implementing a preemption system and wanted to work with !DDT, that behaviour would give you a bad day.
Memory protection in !DDT uses the defined interfaces, but as the 'defined interface' for memory protection doesn't actually work on application space when lazy task swapping is enabled (and can in fact be fatal), that tends to be a bad idea to have enabled on modern systems.
In order to make sure that any claimants of the graphics vectors do not interfere with the output that !DDT itself is going to use (eg for plotting text, windows, etc), it locates the routines in the kernel by knowing a signature for the table, and knowing where the kernel starts in memory. This collusion is obviously broken and can't work when the output functions don't actually live in the Kernel (as is the case with Select 4). Obviously something of the sort it necessary in order to prevent vector claimants such as the printing system, or output redirection such as sprite redirection, from claiming the !DDT output.
These are things that can mostly be fixed relatively easily, but need to be done properly - rather than just hacking another set of constants into !DDT for different system version, or flagging 'this is for StrongARM / Medusa'. In some cases there need to be real APIs for things, and in many cases the existing APIs just need to be used - as !DDT is pretty old and unaware of many of the changes that have gone on beyond the minimum needed to make the application function (for some degree of 'function').
Robin added quite a few useful bits and pieces, including (but not exhaustively):- Hot keys for opening windows
- Tab completion of variables and symbol names
- Debuggee search path variable (makes finding your source so much easier)
- Persistent windows, with proper close icons
- Remembered window positions.
(there were many others, but those ones are the ones that I remember as being hugely beneficial when I was looking at things)
As well as tidying up the code (like the rest of RISC OS things - and, to be fair, most large projects developed over time - there were things that had been dumped in the nearest convenient file), I restructured a lot of little things. Stuff like the innards of the window display were taken apart and put together in a slightly more maintainable way. I remember that much of the window output was something like:
output_string(win, "Break point at address ");
output_hex8(win, bpt);
output_string(win, " at ");
output_string(win, description);
output_newline(win);
which was incredibly tedious, and began to destroy my will to live. I added in some string buffers which supported formatted output - so that the above became:
stringbuffer_format(strb, "Breakpoint at address %8x at %s\n", bpt, description);
The buffers themselves were just line buffers - once filled with a line, they would call a function to add the data to the target. Which in many cases was the newly abstracted display window. By having a complete abstraction of this window, and handlers for clicking on lines, it was possible to create a number of new windows that didn't exist previously.
Rather than the output of menu options going to the main output window, it could go to special windows of their own - the local variables, for example were given a window of their own which would update each time we stepped to a new point (if the window was open). This could be a little costly as determining the local variables could take enough time to be frustrating as you stepped through code. But a list of registers could be more useful if you were looking at assembler, and was far cheaper to display.
The backtrace window was similar, but also allowed you to click on each level in the window and would take you to that context.
All in all the changes appeared relatively cosmetic, but were really useful for debugging a few things.
Disclaimer: By submitting comments through this form you are implicitly agreeing to allow its reproduction in the diary.